
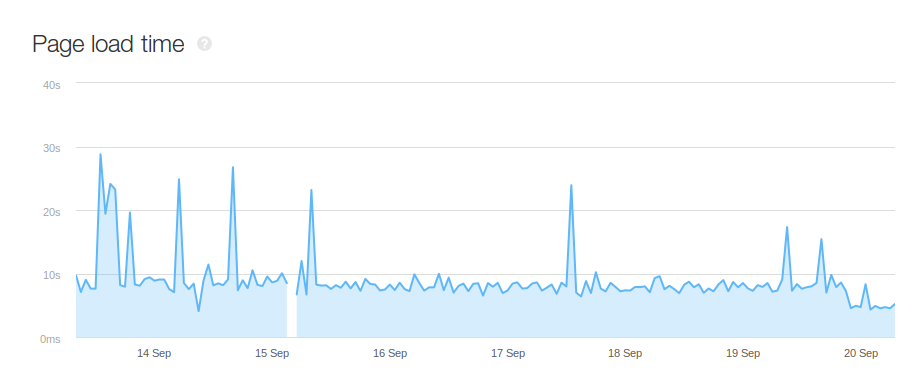
Having been working on Triphippie, an adventure travel marketplace for almost one year now, its pageload time was always one of our biggest issue. We have used Prestashop for Triphippie as it helped us to go live with a complete e-commerce site in less than a week. We did not concentrate on pageload time early on as we were more focussed on improving the product pages and overall features. Due to this negligence, the page load time was around 12-14s which is pathetic, especially for an e-commerce site. However in last 2 weeks, I was forced to work on improving its pageload time. First thing that we worked on was to migrate our images to Cloudfront. We did this successfully and reduced our page load time to around 8s-9s. This was still not good.
It was clear that our server was just taking too much of time to send the response, our first byte response was still around 6.5s. It was time to use a profiler and understand what was causing this. My initial guess was that this was an inherent issue of Prestashop as it depended heavily on data stored in database. To select a profiler, coming from a Java background, my clear intuition was that I needed something which will not force me to modify code unless I wanted some very specific things. I looked around and then came across Blackfire. The main thing I noticed in its documentation is that it can used without modifying the code at all. This suited me and I immediately signed in for the free premium plan for trail.
With the registration, it took just less than 10 mins to get the Agent and PHP Probe installed on the Amazon Linux EC2 instance. I used the Google Chrome Companion of Blackfire to run the profiler. In the first run itself, I noticed that one of the module of Prestashop which we had enabled on the homepage was executing a SQL statement which took 1.1s to execute. And there was another SQL statement which took 600ms to execute. Blackfire has very intuitive UI to analyze profile runs and this makes it very easy to pinpoint issues immediately. Apart from this, most of the other time consuming part were the Smarty Template compilation which was expected.
I just disabled the module which was causing the first SQL statement and to my surprise, my page load time decreases to 4.6s, it just reduced by almost 50% of the previous time. This was probably the most efficient 15 mins that I had ever spent on improving the site. Its really great that I can now just work on improving the site while being able to very easily get the profiler run output on my test machines and make improvement based on the results.